Arduino Circuit Design using BME680 Sensor
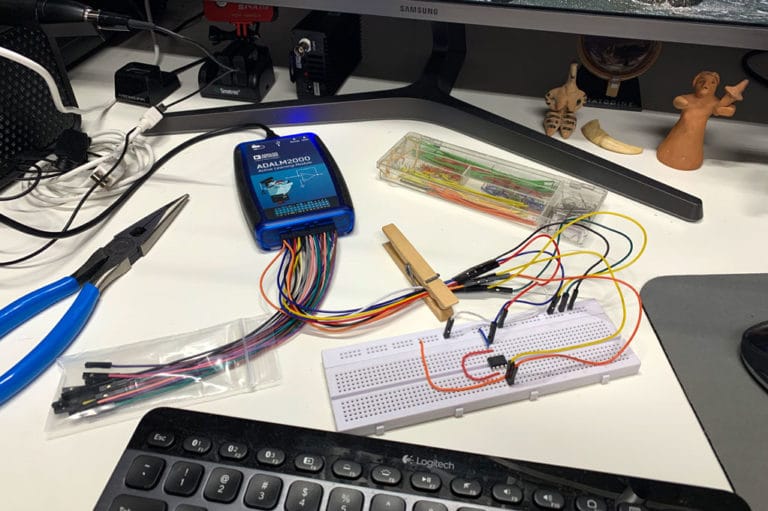
BiophysicsLab.com has added Arduino to its workbench for research and client support.
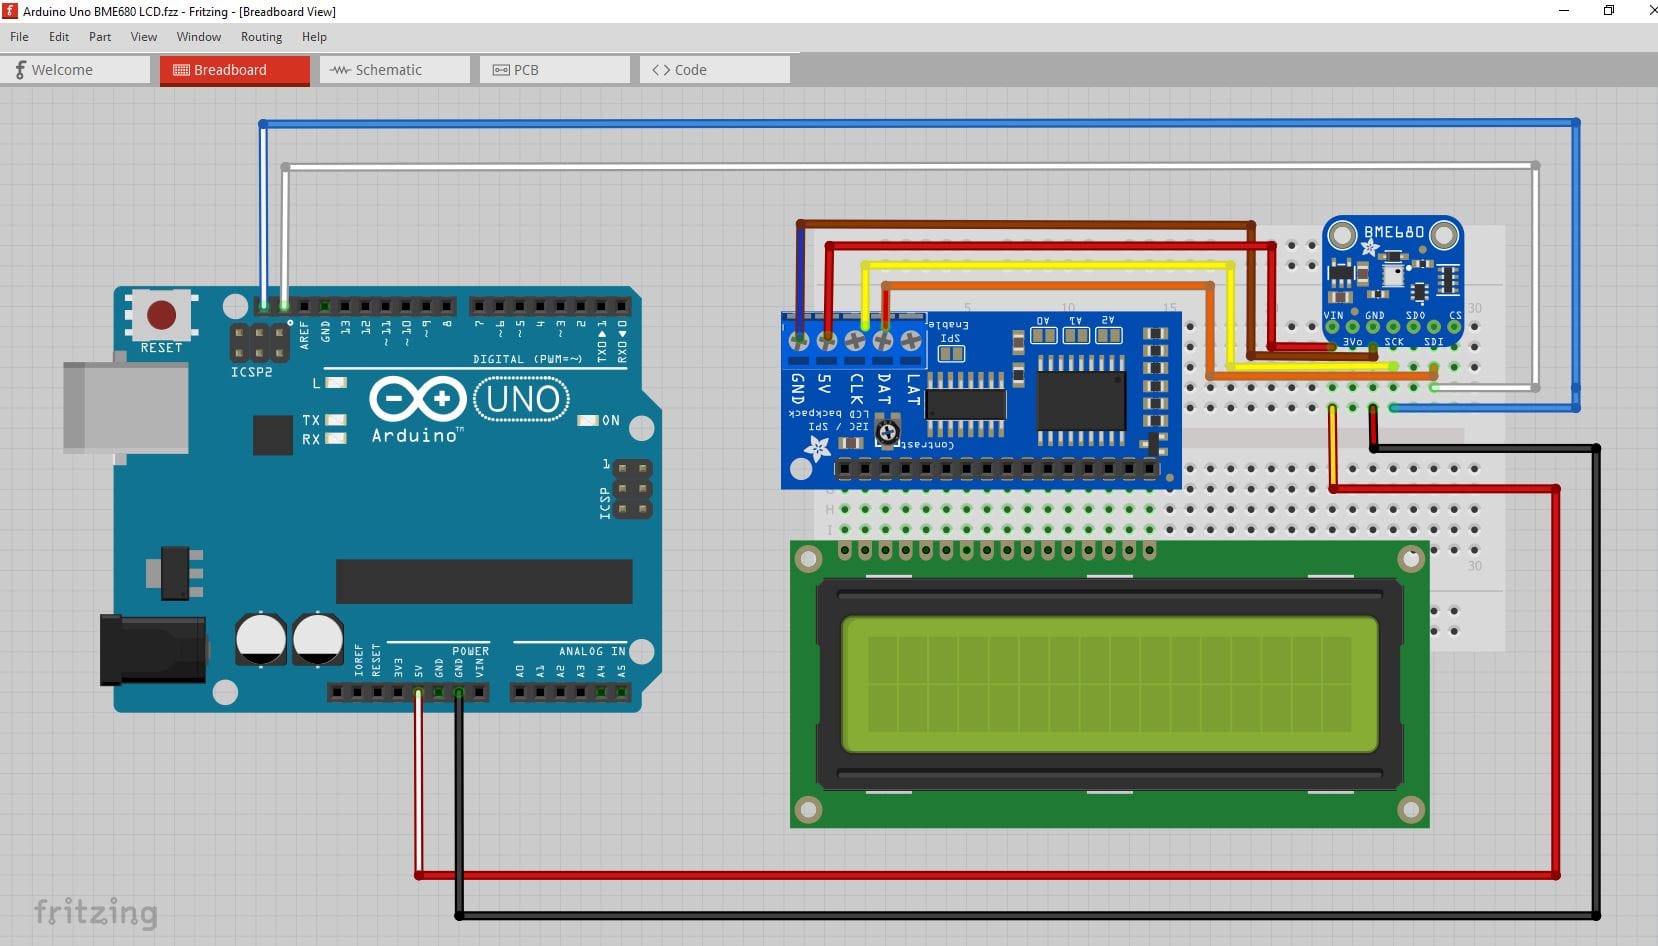
The Circuit
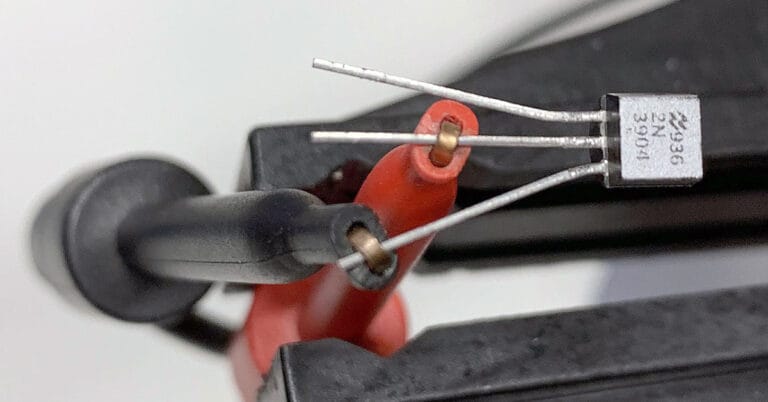
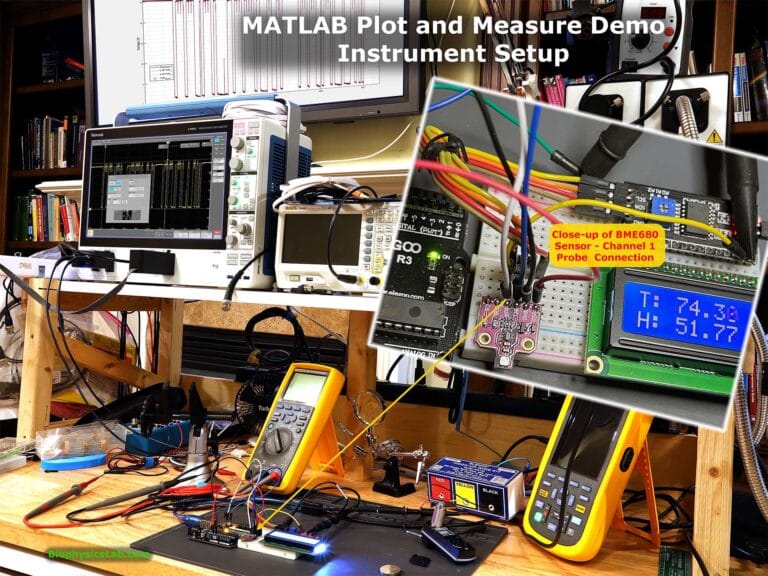
The Arduino Uno and a BME680 sensor board can be used to collect accurate temperature, humidity, pressure, and an indication of volatile organic compounds (VOC) in the air expressed as a changing resistance measure. In this project: An Arduino sketch displays sensor results every 3 seconds on a two-line LCD screen (optional) alternating from temperature with humidity to pressure with gas results. The data is also collected from the Arduino IDE serial port as a simple data logging process for plotting with a MATLAB script. For potential debugging a USB inline multimeter and I2C protocol analyzer are shown.
Bill of materials:
Tools:
- ELEGOO UNO R3 Board ATmega328P with USB Cable (Arduino-Compatible) for Arduino
- ACEIRMC BME680 Digital Temperature Humidity Pressure Sensor Breakout Board Compatible for Arduino Raspberry Pi ESP8266 3~5VDC BME680
- LCD screen, 16 characters x 2 lines, LCD1602 Module ( with pin header)
- LGDehome 5PCS 5V 2004 1602 LCD Display IIC I2C Adapter IIC Serial Interface Adapter for Arduino UNO R3 MEGA DIY Kit
- Mini breadboard, wire, and Dupont 4-pin connector for serial adaptor
- Arduino Integrated Development Environment (IDE)
- Library: https://github.com/adafruit/Adafruit_BME680
- NotePad++ or another text editor (to save test results copied from Arduino IDE serial port)
- Fritzing Software (optional for design)
- Klein Tools USB-A Digital Meter (Optional for stability testing)
- MATLAB (Optional for plotting)
- Tektronix MSO64b with TLP058 FlexChannel Logic Probe and Embedded Protocol I2C and SPI Triggering and Analysis License (Optional for I2C analysis)

Arduino IDE with Serial Port
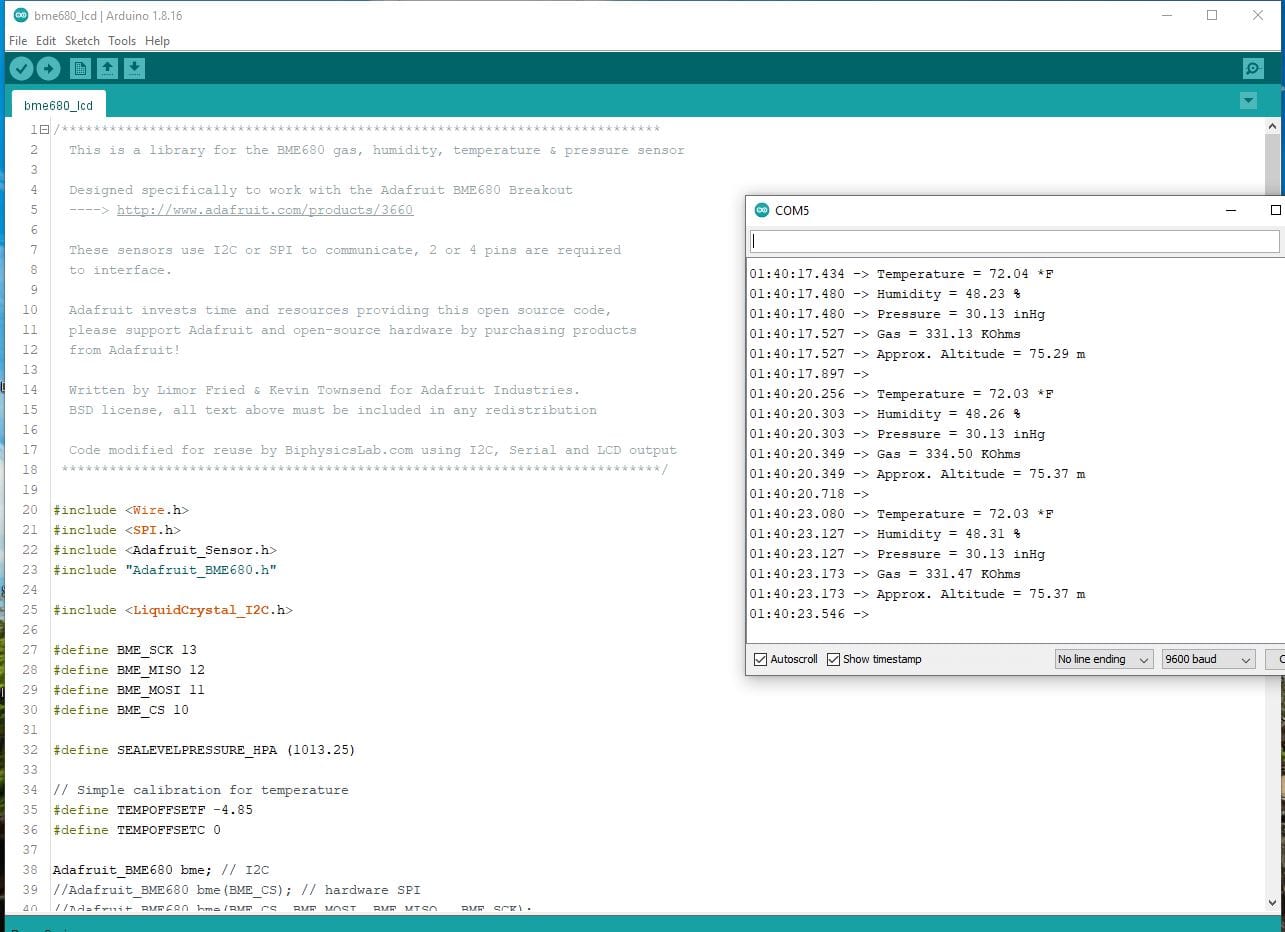
Collecting BME680 results into a text file: I use the serial port output as my data logging storage. My Arduino IDE serial port stores 14+ hours of data in its buffer. Older results simply roll out of the buffer. Ctrl-A (to select all results) followed by Ctrl-C (to copy selected results), then save results into your text editor using Ctrl-V. I am able to save 14+ hours of data with this technique. Older data rolls out of the IDE serial port buffer. The text file has the same format as shown in the figure above including a time stamp followed by 5 data elements: temperature, humidity, pressure, VOC gas, and approximate altitude.
Arduino Sketch
/***************************************************************************
  This is a library for the BME680 gas, humidity, temperature & pressure sensor

  Designed specifically to work with the Adafruit BME680 Breakout
  ----> http://www.adafruit.com/products/3660

  These sensors use I2C or SPI to communicate, 2 or 4 pins are required
  to interface.

  Adafruit invests time and resources providing this open source code,
  please support Adafruit and open-source hardware by purchasing products
  from Adafruit!

  Written by Limor Fried & Kevin Townsend for Adafruit Industries.
  BSD license, all text above must be included in any redistribution

  Code modified for reuse by BiphysicsLab.com using I2C, Serial and LCD output
 ***************************************************************************/

#include <Wire.h>
#include <SPI.h>
#include <Adafruit_Sensor.h>
#include "Adafruit_BME680.h"

#include <LiquidCrystal_I2C.h>

#define BME_SCK 13
#define BME_MISO 12
#define BME_MOSI 11
#define BME_CS 10

#define SEALEVELPRESSURE_HPA (1013.25)

// Simple calibration for temperature
#define TEMPOFFSETF -4.85
#define TEMPOFFSETC 0

Adafruit_BME680 bme; // I2C
//Adafruit_BME680 bme(BME_CS); // hardware SPI
//Adafruit_BME680 bme(BME_CS, BME_MOSI, BME_MISO,  BME_SCK);

// Where 0x27 is the LCD I2C address
LiquidCrystal_I2C lcd(0x27, 16, 2);


int pauseTime = 2000; // microseconds between readings
int screenReadings = 5; // readings per screen (T and P, H and G)
int screenCount = 0;

void setup() {
  Serial.begin(9600);
  while (!Serial);
  Serial.println(F("BME680 test"));

  if (!bme.begin()) {
    Serial.println("Could not find a valid BME680 sensor, check wiring!");
    while (1);
  }

  lcd.init();
  lcd.backlight();
  lcd.setCursor(0, 0);

  // Set up oversampling and filter initialization
  bme.setTemperatureOversampling(BME680_OS_8X);
  bme.setHumidityOversampling(BME680_OS_2X);
  bme.setPressureOversampling(BME680_OS_4X);
  bme.setIIRFilterSize(BME680_FILTER_SIZE_3);
  bme.setGasHeater(320, 150); // 320*C for 150 ms
}

void loop() {
  if (! bme.performReading()) {
    Serial.println("Failed to perform reading :(");
    return;
  }
  Serial.print("Temperature = ");
  Serial.print(tempConvert(bme.temperature));
  Serial.println(" *F");

  Serial.print("Humidity = ");
  Serial.print(bme.humidity);
  Serial.println(" %");

  Serial.print("Pressure = ");
  Serial.print(pressureConvert(bme.pressure / 100.0));
  Serial.println(" inHg");

  Serial.print("Gas = ");
  Serial.print(bme.gas_resistance / 1000.0);
  Serial.println(" KOhms");

  Serial.print("Approx. Altitude = ");
  Serial.print(bme.readAltitude(SEALEVELPRESSURE_HPA));
  Serial.println(" m");

  if (screenCount < screenReadings)
  {

    if (screenCount == 0)
    {
      lcd.clear();
    }

    lcd.setCursor(0, 0);
    lcd.print("T: ");
    lcd.print(tempConvert(bme.temperature));
    lcd.print(" *F");

    lcd.setCursor(0, 1);
    lcd.print("H: ");
    lcd.print(bme.humidity);
    lcd.print(" %");

  } else if (screenCount < 2 * screenReadings)
  {

    if (screenCount == (screenReadings + 1))
    {
      lcd.clear();
    }

    lcd.setCursor(0, 0);
    lcd.print("P: ");
    lcd.print(pressureConvert(bme.pressure / 100.0));
    lcd.print(" inHg");

    lcd.setCursor(0, 1);
    lcd.print("G: ");
    lcd.print(bme.gas_resistance / 1000.0);
    lcd.print(" KOhms");
  } else

  {
    screenCount = -1;
  }


  Serial.println();
  delay(pauseTime);
  screenCount++;
}

float tempConvert(float T)
{
  // Convert temperature T in degrees C to degrees F
  return T * 1.8 + 32. + TEMPOFFSETF;
}

float pressureConvert(float P)
// Convert pressure P in hPA to in Hg
{
  return P * .030;
}
MATLAB BME680 Plot
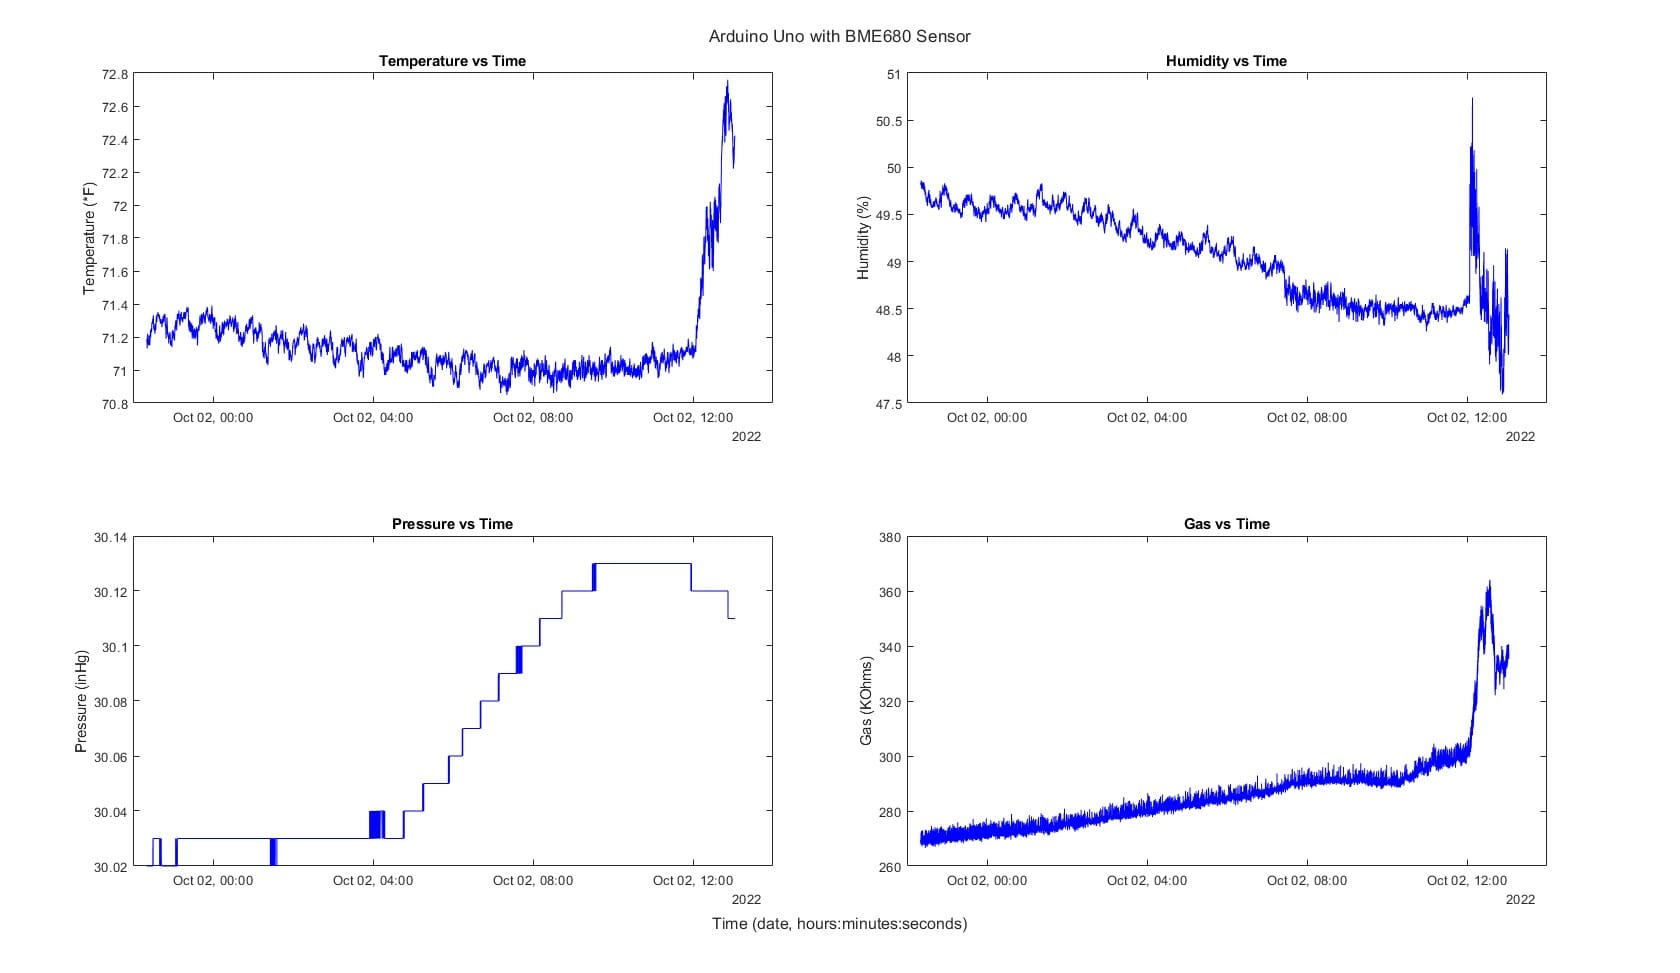
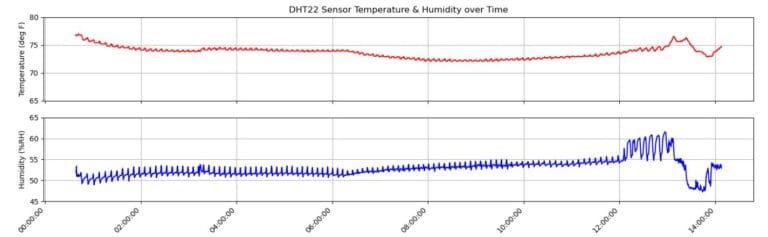
The sensor circuit was running for about 20 hours in my basement lab with the last 14 hours shown in the above plot. Most of the plot’s sensors vs time show a relatively stable environment during the late night/early morning (note that the pressure plot is over a very narrow range in inHg), while the Gas vs Time plot needs more work in my opinion. Changes were more dramatic when I came to work and opened some windows around noon. The Gas vs Time plot demonstrates that more features should be investigated related to stability, calibration, denoising, and cross-sensor effects starting with the public domain BME680 Gas sensor BOSH/Adafruit libraries.
MATLAB Script
%% Plot Arduino Serial Port BME680 Results
% Script: ReadSerialDataCaptureTK2.m
% BiophysicsLab.com
% Initial code release: 10/3/2022

%% Create textfile using data output to the Arduino Serial Port
% Where:
%   Data captured in serial port using Ctrl-A followed by Ctrl-C
%   Text file created by pasting captured data into Notepad++ (or other
%   editor).
%   Save text file into same directory as this code
% Read the textfile as a table:
%   Var1 = Time
%   Var3 = Param name (Temperature, Humidity, Pressure, Gas, 'Approx.', ''
%   Var4 = "=", expect for 5'th element which is 'Altitude', ''
%   Var5 = Parameter value (temp, hum, pres, gas, NaN, NaN)
%   Var6 = Param units: *F, %, inHG, KOhms, value for 'approx. altitude',''
%   Var7 = '', '', '', '', parameter units for 'approx. altitude' 'm', ''
% Plot results

% Table values:
%   time entries are in Column 1, Var1, of every row
% Table y values:
%   Row 1: Column 5, Var5, has the temperature value
%   Row 2: Column 5, Var5, has the humidity value
%   Row 3: Column 5, Var5, has the pressure value
%   Row 4: Column 5, Var5, has the gas value
%   Skip rows 5 and 6
%   Repeat

%% Parameters
tableFileName = 'SerialDataCapture_04.txt'; % name of saved data as text file
tUnits = "Date"; % x-axis time units as a string: "Date" or "Seconds"
xAxisDate = '2022-10-01'; % set date for x-axis plots (when test was run)

disp('readtable');
T = readtable(tableFileName);

%% Plot
figure('Name','Arduino Uno with BME680 Sensor','NumberTitle','off');
% Lay out the four plots (Temperature, Humidity, Pressure, and Gas)
% in a 2x2 format.
layout = tiledlayout(2,2);
title(layout, 'Arduino Uno with BME680 Sensor')

% Prepare plot time on x-axis
Ttime = T.Var1(1:6:end);
[tDuration, sDuration, elapsedTimeArray] = calculateDuration(Ttime, tUnits);
if tUnits == "Date"
    plotTime = datetime(xAxisDate) + elapsedTimeArray;
    xlabel(layout,'Time (date, hours:minutes:seconds)')
else
    plotTime = elapsedTimeArray;
    xlabel(layout,'Time (seconds)')
end


nexttile % Temperature
plot(plotTime, T.Var5(1:6:end), "Blue")
[yAxisTitleStr, yAxisUnitsStr] = packageAxisInfo(T.Var3(1), T.Var6(1));
title([ yAxisTitleStr ' vs Time'])
ylabel([yAxisTitleStr ' (' yAxisUnitsStr ')'])


nexttile % Humidity
%   first time/humidity entry is row 2, then every 6'th row until eof
plot(plotTime, T.Var5(2:6:end), "Blue")
[yAxisTitleStr, yAxisUnitsStr] = packageAxisInfo(T.Var3(2), T.Var6(2));
title([ yAxisTitleStr ' vs Time'])
ylabel([yAxisTitleStr ' (' yAxisUnitsStr ')'])


nexttile % Pressure
%   first time/pressure entry is row 3, then every 6'th row until eof
plot(plotTime, T.Var5(3:6:end), "Blue")
[yAxisTitleStr, yAxisUnitsStr] = packageAxisInfo(T.Var3(3), T.Var6(3));
title([ yAxisTitleStr ' vs Time'])
ylabel([yAxisTitleStr ' (' yAxisUnitsStr ')'])


nexttile % Gas
%   first time/gas entry is row 4, then every 6'th row until eof
plot(plotTime, T.Var5(4:6:end), "Blue")
[yAxisTitleStr, yAxisUnitsStr] = packageAxisInfo(T.Var3(4), T.Var6(4));
title([ yAxisTitleStr ' vs Time'])
ylabel([yAxisTitleStr ' (' yAxisUnitsStr ')'])


%% Package y-axis title (yAT) and y-axis Units (yAU) from table to chars
% Where:
%   T1 is a y-axis title in cell format
%   T2 is a y-axis units in cell format
function [yAT, yAU] = packageAxisInfo(T1, T2)
    yAT = convertStringsToChars(string(T1));
    yAU = convertStringsToChars(string(T2));
end


%% Package x-axis from table to duration
%   average time step (tTimeStep)
%   standard deviation (stdTimeStep)
%   elapsed time array in tUnits
%   tUnits are "seconds" or "date" case independent
function [tTimeStep, stdTimeStep, elapsedTimeArray] = calculateDuration(timeReadings, tUnits)
    i = 1;
    lengthTimeReadings = length(timeReadings);
    tArray = zeros(1,lengthTimeReadings);
    elapsedTimeArray = tArray;
    while(i<lengthTimeReadings)
        tDiff = timeReadings(i+1)-timeReadings(i);
        if tDiff<0
            tDiff = timeReadings(i+1) + duration(24,0,0) - timeReadings(i);
        end
        tArray(i) = seconds(tDiff);
        if i>1
            elapsedTimeArray(i) = elapsedTimeArray(i-1) + tArray(i);
        else
            elapsedTimeArray(i) = tArray(i);
        end
        i = i + 1;
    end

    tTimeStep = mean(tArray(1:lengthTimeReadings-1)); % Value for my 9 hour test run: 2.8221 ave secs/test
    stdTimeStep = std(tArray(1:lengthTimeReadings-1)); % Value for my 9 hour test run: 0.0215

    % last time difference + average time difference copied to last array time
    % return time in seconds
    elapsedTimeArray(lengthTimeReadings) = elapsedTimeArray(lengthTimeReadings-1) + tTimeStep;
    if lower(tUnits) == "date"
        zinterval = timeReadings(1);
        elapsedTimeArray = zinterval + seconds(elapsedTimeArray);
        elapsedTimeArray.Format = 'dd:hh:mm:ss';
    end
end
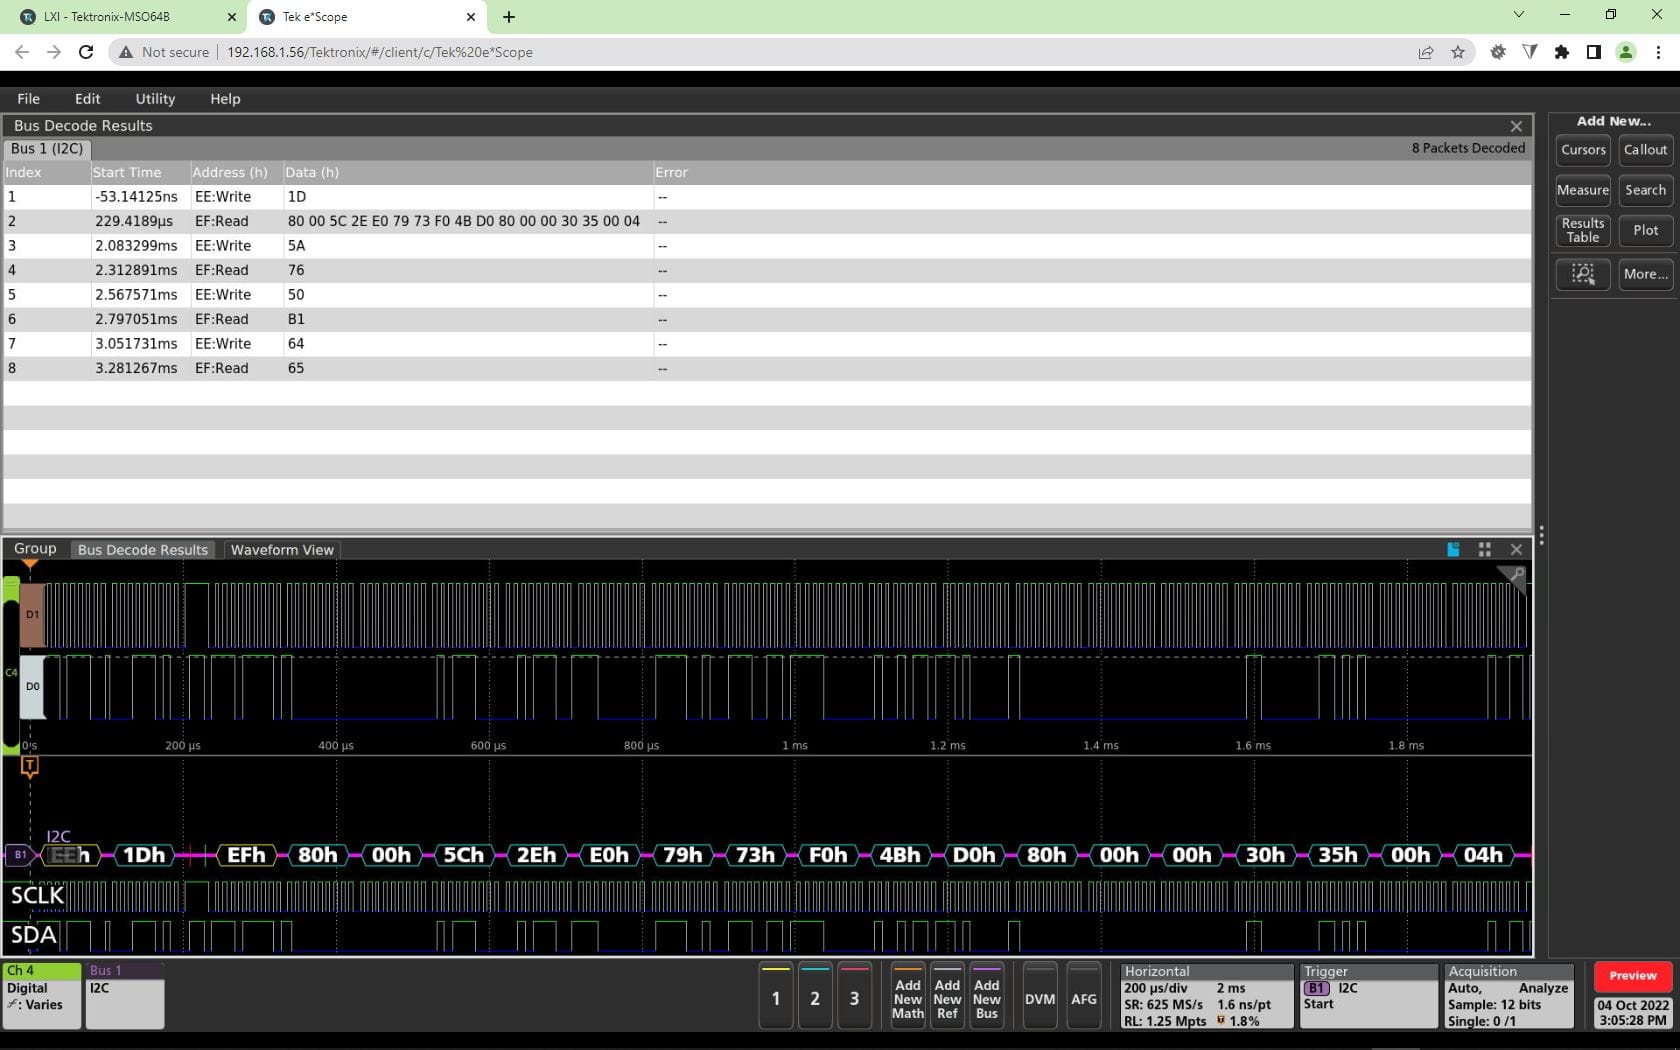
Test I2C Bus Between Arduino Uno, LCD, and BME680 Sensor
References
MATLAB plot script along with text file to generate the plot: Download Zip File
Arduino BME680 sketch described here, and a 14-hour sensor results text file for MATLAB: Download Zip File
Adafruit BME680 – Temperature, Humidity, Pressure and Gas Sensor product information page: https://www.adafruit.com/product/3660
Bosh Sensortek BME68x-Sensor information page: https://www.bosch-sensortec.com/products/environmental-sensors/gas-sensors/bme680/
I want to thank Dr. Peter Dalmaris for delivering an excellent introductory course on the Udemy MOOC teaching platform: https://www.udemy.com/course/arduino-sbs-17gs/